SpectRobot
Learning tactile perception
from high-bandwidth single-point sensing
1 Wormsensing, France · 2 Hugging Face, France · *Corresponding author
Abstract
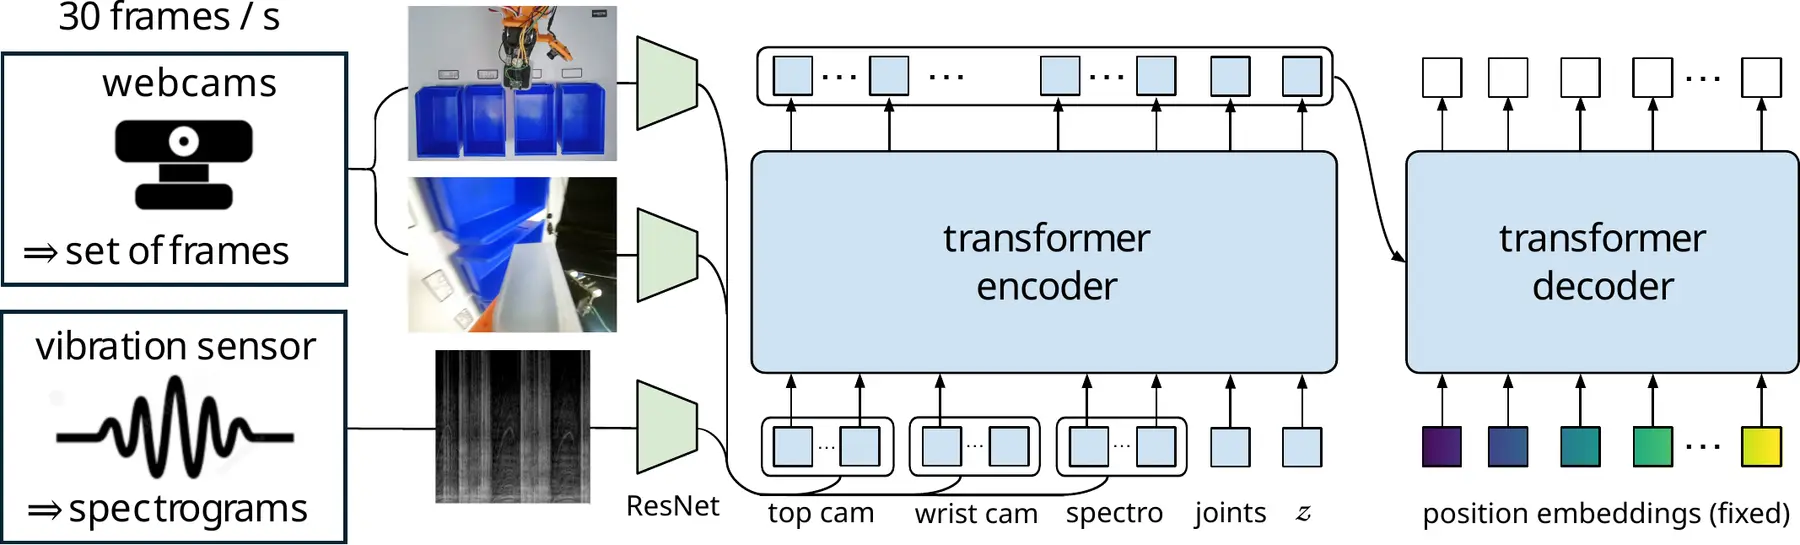
Tactile sensing is increasingly being incorporated into learning-based robotic manipulation, yet many existing approaches rely on spatially distributed sensors. Here we introduce SpectRobot, a framework that transforms single-point tactile signals into compact time-frequency spectrograms. They can be processed by standard vision encoders and integrated into learning pipelines originally developed for vision, while preserving temporal and frequency information unavailable to conventional cameras.
Tactile sorting under visual occlusion
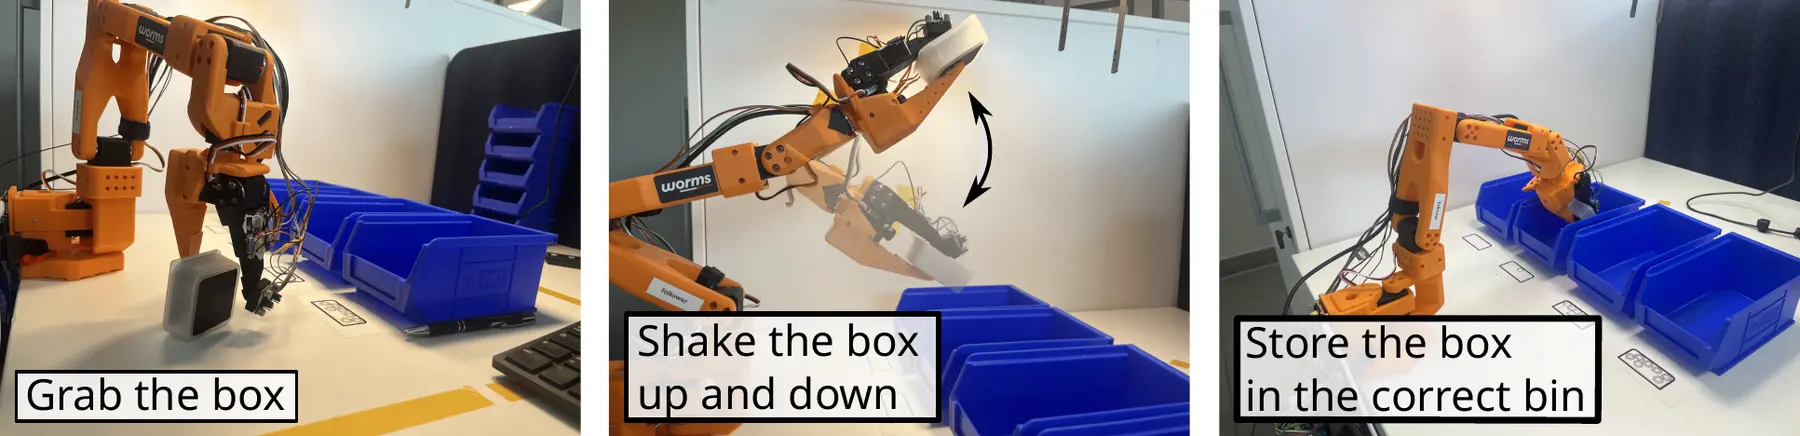
The robot picks up an opaque box, gently shakes it, and must infer one of four visually indistinguishable contents from vision and tactile spectrogram before placing the box in the corresponding bin.
Top camera
Wrist camera
Tactile spectrogram 0–10 kHz2.9 s
Gripper A: IEPE Dragonfly® sensor, 0–10 kHz, nFFT = 512 (2.9 s temporal history).
Sensor & acquisition system benchmark
Many sensors in our benchmark achieve comparable results and perform very well on the SpectRobot framework. We intentionally limited the training dataset to just 40 episodes to accentuate differences in performance. The main failure mode occurred when the robot did not shake the box effectively enough, resulting in weaker signals for analysis.
Attention maps
The trained ACT models were analyzed with Emboviz (GitHub), focusing on internal attention weights computed during the forward pass. A clear pattern can be observed in the spectrogram between approximately 11 and 14 seconds in the video. During this period, the model's attention becomes concentrated primarily in the 4 to 6 kHz frequency range.
Top camera + attention map
Wrist camera + attention map
Tactile spectrogram + attention map
Citation
If you use SpectRobot in your research, please cite our arXiv paper.
@misc{rigal2026spectrobot,
  title         = {SpectRobot: Learning tactile perception from high-bandwidth single-point sensing},
  author        = {Joseph Rigal and Emmanuel Virot and Caroline Pascal},
  journal       = {arXiv preprint arXiv:2609.24621},
  year          = {2026},
  url           = {https://arxiv.org/abs/2609.24621}
}
